RSS

Real Estate Board of Greater Vancouver July 2019 Market Stats

The July 2019 Market stats are out and available for download. You get the following graphs and charts for both Vancouver East and Vancouver West.

  • Activity Snapshot by PropertyType
  • Detached Properties Report and Graph
  • Condo Report and Graph
  • Townhomes Report and Graph
  • Benchmark Price Graph
  • Average Price Per Square Foot
If you are interested in a report like this is for other areas, please contact me to request it and I'll send it to you.
 
Read

Home sales increase in July


Home buyer demand picked up across Metro Vancouver last month, making July, a traditionally quieter month in real estate, the second highest selling month so far this year.


The Real Estate Board of Greater Vancouver (REBGV) reports that residential home sales in the region totalled 2,557 in July 2019, a 23.5 per cent increase from the 2,070 sales recorded in July 2018, and a 23.1 per cent increase from the 2,077 homes sold in June 2019.


Last month’s sales were 7.8 per cent below the 10-year July sales average.


“While home sale activity remains below long-term averages, we saw an increase in sales in July compared to the less active spring we experienced,” Ashley Smith, REBGV president said. “Those looking to buy today continue to benefit from low interest rates, increased selection, and reduced prices compared to the heated market a few years ago.”


There were 4,613 detached, attached and apartment properties newly listed for sale on the Multiple Listing Service® (MLS®) in Metro Vancouver in July 2019. This represents a 3.3 per cent decrease compared to the 4,770 homes listed in July 2018 and a 2.9 per cent decrease compared to June 2019 when 4,751 homes were listed.


The total number of homes currently listed for sale on the MLS® system in Metro Vancouver is 14,240, a 17.3 per cent increase compared to July 2018 (12,137) and a 4.9 per cent decrease compared to June 2019 (14,968).

For all property types, the sales-to-active listings ratio for July 2019 is 18 per cent. By property type, the ratio is 13.5 per cent for detached homes, 20 per cent for townhomes, and 22 per cent for apartments.


Generally, analysts say downward pressure on home prices occurs when the ratio dips below 12 per cent for a sustained period, while home prices often experience upward pressure when it surpasses 20 per cent over several months.


“To better understand conditions in your property type or neighbourhood of choice, it’s important to work with your local REALTOR®. They can help you develop a strategy to reach your long-term real estate goals,” Smith said.

The MLS® Home Price Index composite benchmark price for all residential properties in Metro Vancouver is currently $995,200. This represents a 9.4 per cent decrease over July 2018 and a 0.3 per cent decrease compared to June 2019.


Sales of detached homes in July 2019 reached 841, a 32 per cent increase from the 637 detached sales recorded in July 2018. The benchmark price for detached properties is $1,417,000. This represents a 10.5 per cent decrease from July 2018, and a 0.5 per cent decrease compared to June 2019.


Sales of apartment homes reached 1,243 in July 2019, a 15.2 per cent increase compared to the 1,079 sales in July 2018. The benchmark price of an apartment property is $653,200. This represents an 8.8 per cent decrease from July 2018, and a 0.2 per cent decrease compared to June 2019.


Attached home sales in July 2019 totalled 473, a 33.6 per cent increase compared to the 354 sales in July 2018. The benchmark price of an attached unit is $770,000. This represents a nine per cent decrease from July 2018, and a 0.6 per cent decrease compared to June 2019.


GET THE FULL REPORT


Read

Real Estate Board of Greater Vancouver June 2019 Market Stats

The June 2019 Market stats are out and available for download. You get the following graphs and charts for both Vancouver East and Vancouver West.

  • Activity Snapshot by PropertyType
  • Detached Properties Report and Graph
  • Condo Report and Graph
  • Townhomes Report and Graph
  • Benchmark Price Graph
  • Average Price Per Square Foot
If you are interested in a report like this is for other areas, please contact me to request it and I'll send it to you.
 
Read

Housing supply up, home sales and prices down in June

With home buyer demand below long-term historical averages in June, the supply of homes for sale continued to accumulate in Metro Vancouver.

The Real Estate Board of Greater Vancouver (REBGV) reports that residential home sales in the region totalled 2,077 in June 2019, a 14.4 per cent decrease from the 2,425 sales recorded in June 2018 and a 21.3 per cent decrease from the 2,638 homes sold in May 2019.

Last month’s sales were 34.7 per cent below the 10-year June sales average. This is the lowest total for the month since 2000.

“We’re continuing to see an expectation gap between home buyers and sellers in Metro Vancouver,” said Ashley Smith, REBGV president. “Sellers are often trying to get yesterday’s values for their homes while buyers are taking a cautious, wait-and-see approach.”

On the supply side, there were 4,751 detached, attached and apartment properties newly listed for sale on the Multiple Listing Service® (MLS®) in Metro Vancouver in June 2019. This represents a 10 per cent decrease compared to the 5,279 homes listed in June 2018 and an 18.9 per cent decrease compared to May 2019 when 5,861 homes were listed.

The total number of homes currently listed for sale on the MLS® system in Metro Vancouver is 14,968, a 25.3 per cent increase compared to June 2018 (11,947) and a 1.9 per cent increase compared to May 2019 (14,685).

“Home buyers haven’t had this much selection to choose from in five years,” Smith said. “For sellers to be successful in today’s market, it’s important to work with your local REALTOR® to make sure you’re pricing your home for these conditions.”

For all property types, the sales-to-active listings ratio for June 2019 is 13.9 per cent. By property type, the ratio is 11.4 per cent for detached homes, 15.8 per cent for townhomes, and 15.7 per cent for apartments.

Generally, analysts say that downward pressure on home prices occurs when the ratio dips below 12 per cent for a sustained period, while home prices often experience upward pressure when it surpasses 20 per cent over several months.

The MLS® Home Price Index composite benchmark price for all residential properties in Metro Vancouver is currently $998,700. This represents a 9.6 per cent decrease over June 2018 and a 0.8 per cent decrease compared to May 2019.

This is the first time the composite benchmark has been below $1 million since May 2017.

Sales of detached homes in June 2019 reached 746, a 2.6 per cent decrease from the 766 detached sales recorded in June 2018. The benchmark price for detached properties is $1,423,500. This represents a 10.9 per cent decrease from June 2018 and a 0.1 per cent increase compared to May 2019.

Sales of apartment homes reached 941 in June 2019, a 24.1 per cent decrease compared to the 1,240 sales in June 2018. The benchmark price of an apartment property is $654,700. This represents an 8.9 per cent decrease from June 2018 and a 1.4 per cent decrease compared to May 2019.

Attached home sales in June 2019 totalled 390, a 6.9 per cent decrease compared to the 419 sales in June 2018. The benchmark price of an attached unit is $774,700. This represents an 8.6 per cent decrease from June 2018 and a 0.6 per cent decrease compared to May 2019.


GET THE FULL REPORT

Read

Real Estate Board of Greater Vancouver May 2019 Market Stats

The May 2019 Market stats are out and available for download. You get the following graphs and charts for both Vancouver East and Vancouver West.

  • Activity Snapshot by PropertyType
  • Detached Properties Report and Graph
  • Condo Report and Graph
  • Townhomes Report and Graph
  • Benchmark Price Graph
  • Average Price Per Square Foot
If you are interested in a report like this is for other areas, please contact me to request it and I'll send it to you.
 
Read

May sees modest increase in home sales while housing supply reaches five-year high


Monthly *Metro Vancouver1 home sales eclipsed 2,000 for the first time this year in May, although home buyer demand remains below historical averages.


The Real Estate Board of Greater Vancouver (REBGV) reports that residential home sales in the region totalled 2,638 in May 2019, a 6.9 per cent decrease from the 2,833 sales recorded in May 2018, and a 44.2 per cent increase from the 1,829 homes sold in April 2019.


Last month’s sales were 22.9 per cent below the 10-year May sales average and was the lowest total for the month since 2000.


“High home prices and mortgage qualification issues caused by the federal government’s B20 stress test remain significant factors behind the reduced demand that the market is experiencing today,” Ashley Smith, REBGV president said.


There were 5,861 detached, attached and apartment properties newly listed for sale on the Multiple Listing Service® (MLS®) in Metro Vancouver last month. This represents an 8.1 per cent decrease compared to the 6,375 homes listed in May 2018 and a 2.1 per cent increase compared to April 2019 when 5,742 homes were listed.


The total number of homes currently listed for sale on the MLS® system in Metro Vancouver is 14,685, a 30 per cent increase compared to May 2018 (11,292) and a 2.3 per cent increase compared to April 2019 (14,357). This is the highest number of homes listed for sale since September 2014 (14,832).


“Whether you’re a buyer looking to make an offer or a seller looking to list your home, getting your pricing right is the key in today’s market,” Smith said. “To be competitive, it’s important to work with your local REALTOR® to assess and understand the latest trends in your neighbourhood and property type of choice.”


For all property types, the sales-to-active listings ratio for May 2019 is 18 per cent. By property type, the ratio is 14.2 per cent for detached homes, 20 per cent for townhomes, and 21.2 per cent for apartments.


Generally, analysts say downward pressure on home prices occurs when the ratio dips below 12 per cent for a sustained period, while home prices often experience upward pressure when it surpasses 20 per cent over several months.


*The MLS® Home Price Index2 composite benchmark price for all residential homes in Metro Vancouver is currently $1,006,400. This represents an 8.9 per cent decrease over May 2018, a 3.4 per cent decrease over the past six months, and a 0.4 per cent decrease compared to April 2019.


Sales of detached homes in May 2019 reached 913, a 1.4 per cent decrease from the 926 detached sales recorded in May 2018. The benchmark price for a detached home in the region is $1,421,900. This represents an 11.5 per cent decrease from May 2018, a 5.4 per cent decrease over the past six months, and a 0.5 per cent decrease compared to April 2019.

Sales of apartment homes reached 1,246 in May 2019, a 12.9 per cent decrease compared to the 1,431 sales in May 2018. The benchmark price of an apartment property is $664,200. This represents a 7.3 per cent decrease from May 2018, a two per cent decrease over the past six months, and a 0.5 per cent decrease compared to April 2019.


Attached home sales in May 2019 totalled 479, a 0.6 per cent increase compared to the 476 sales in May 2018. The benchmark price of an attached unit is $779,400. This represents a 7.6 per cent decrease from May 2018, a 3.5 per cent decrease over the past six months, and a 0.6 per cent increase compared to April 2019.


DOWNLOAD THE FULL REPORT

Read

Best Places to Live: Vancouver

Located in the Lower Mainland of British Columbia, Vancouver is the most populous city in the province with more than 600,000 people. Vancouver is a coastal seaport city with some of the warmest year-round temperatures in Canada. It boasts a beautiful landscape of sea and mountains and is a popular place for outdoor and urban enthusiasts.


We know that Canadian’s truly celebrate the liveabililty factors of their neighbourhood – the qualities that give homeowners the true satisfaction of their home within the context of a neighbourhood. In fact a Leger survey conducted by RE/MAX revealed that 89% of Canadians recommend their neighbourhoods to others. Unlike your home, neighbourhoods cannot be changed, so it is important to assess what qualities are important to you before you purchase. Luckily, when it comes to Vancouver, there is a lot of celebrate in terms of liveability.


A survey of RE/MAX Brokers revealed that the best places to live in Vancouver are MainWest End and Kerrisdale rank as the top three neighbourhoods in Vancouver for access to green spaces and parks, walkability, retail and restaurants and the ease of getting around/public transit.


In the same Leger survey, six-in-10 Canadians put easy access to shopping, dining and green spaces at the top of their liveability criteria. Proximity to public transit (36 per cent), work (30 per cent) and to preferred schools (18 per cent), as well as cultural and community centres (18 per cent) fall out of the top five neighbourhood wants and expectations. So how does Vancouver stack up? 


If you are searching for the best place to live in Vancouver, Main ranks as the top hidden gem neighbourhood, while Mount PleasantDowntown – Vancouver West and Renfrew-Collingwood rank as the top three neighbourhoods for affordability and good supply of housing inventory.


Interested in seeing how Vancouver compares to other cities across Canada? Explore the RE/MAX Liveability Report to learn more about the features Canadians value when it comes to the places they live. 

Read

Best Places to Live: Canada Liveability Report

Canadians love where they live; RE/MAX Report explores some of the best places to live in Canada

  • 89 per cent of Canadians would recommend their neighbourhoods to others
  • Major Canadian cities are a beacon for liveability

Canadians genuinely celebrate the liveability factors — the qualities that give each homeowner the true satisfaction of his/her home within the context of a neighbourhood — when it comes to choosing a property to buy and live in. In fact, 89 per cent of Canadians would recommend their neighbourhood to others according to a recent RE/MAX survey conducted by Leger. The latest RE/MAX report examined a variety of quality of life factors and how they impact Canadians’ home-buying decisions.


“Housing is often a contentious topic in Canada, with affordability and inventory being persistent problems from coast to coast,” says Christopher Alexander, Executive Vice President, RE/MAX of Ontario-Atlantic Canada. “However, when buyers are looking for a home, the search begins at the neighbourhood level. And the good news is that Canadians have lots of choice when it comes to ‘liveable’ cities and neighbourhoods.”


Six-in-10 Canadians put easy access to shopping, dining and green spaces at the top of their liveability criteria. Proximity to public transit (36 per cent), work (30 per cent) and to preferred schools (18 per cent), as well as cultural and community centres (18 per cent) fall out of the top five neighbourhood wants and expectations.

The proximity and availability of these liveability factors is so important that Canadians spend more than two-thirds of their time in their own neighbourhood. This rate is higher among Baby Boomers compared to Gen Z, Millennial and Gen X Canadians.


“While price and value are always top of mind for buyers, there are some aspects about a home that you can’t change,” says Alexander. “These liveability factors are what make your home more than just the place you live. They are at the heart of the Canadian experience, especially when you consider the survey results.”


RE/MAX brokers were also asked to tap into their neighbourhood expertise and rate their city on each liveability factor.


In the west, Calgary ranked high in seven out of 11 categories, including offering good access to employment opportunities, population growth, housing supply, housing affordability and easy access to bike lanes and/or walking paths. Confederation and Nose Hill Park are two of the most popular parks in the city and the Rotary Mattamy Greenway is the cycling equivalent to the ring road. Inglewood, Hillhurst and Charleswood rank as the top three all-around liveable neighbourhoods. Edmonton also ranked high in access to employment opportunities, number of top rated/preferred schools and easy access to bike lanes and/or walking paths.


“Despite reports of slowing economic conditions and a relatively flat real estate market in Alberta, Calgary and Edmonton shine as beacons of liveability,” says Elton Ash, Regional Executive Vice President, RE/MAX of Western Canada. “This is a promising sign for any buyers considering a purchase in either city as they continue to develop as liveable cities in their own right.”


Toronto ranked medium for access to green spaces and parks but high for availability of big and small retail stores, population growth and access to healthcare facilities. The neighbourhoods that rated highest for access to green space and parks – Rosedale, Leaside and The Beaches – are also the most expensive. Conversely, Toronto’s most affordable neighbourhoods include parts of Scarborough and East York.


Vancouver ranked medium for availability of big and small retail stores, population growth and housing supply. However, it ranked high in availability of public transit, where the Skytrain and bus system prove exceptional; and walkability, especially in Yaletown. Main, West End and Kerrisdale are the top three all-around liveable neighbourhoods in Vancouver while Mount Pleasant, Downtown and Renfrew-Collingwood are the most affordable.


Other regions include Ottawa, where The Glebe neighbourhood is the best for walkability and public transit; Halifax, where Clayton park boasted high inventory; Hamilton, where Beasley was best for affordability; Winnipeg, where Transcona is a hidden gem neighbourhood; Saskatoon, where Nutana is the all-around best neighbourhood for liveability; and Nanaimo, where Central Nanaimo is best for affordability.


“Liveability encompasses the many intangibles when buying and selling a home than an algorithm will never sufficiently capture. You need word of mouth and the on-the-ground expertise of a REALTOR® who has genuine locale knowledge like few others,” adds Ash.

Key findings from the 2019 RE/MAX Liveability Report Survey

Learn more about Vancouver in this report by clicking here.

Read

Real Estate Board of Greater Vancouver April 2019 Market Stats

The April 2019 Market stats are out and available for download. You get the following graphs and charts for both Vancouver East and Vancouver West.

  • Activity Snapshot by PropertyType
  • Detached Properties Report and Graph
  • Condo Report and Graph
  • Townhomes Report and Graph
  • Benchmark Price Graph
  • Average Price Per Square Foot
If you are interested in a report like this is for other areas, please contact me to request it and I'll send it to you.
 
Read

Reduced demand and increased supply remain the trend across Metro Vancouver’s housing market

Decreased demand continues to allow the supply of homes for sale to accumulate across the Metro Vancouver housing market.


The Real Estate Board of Greater Vancouver (REBGV) reports that residential home sales in the region totalled 1,829 in April 2019, a 29.1 per cent decrease from the 2,579 sales recorded in April 2018, and a 5.9 per cent increase from the 1,727 homes sold in March 2019.


Last month’s sales were 43.1 per cent below the 10-year April sales average.


“Government policy continues to hinder home sale activity. The federal government’s mortgage stress test has reduced buyers’ purchasing power by about 20 per cent, which is causing people at the entry-level side of the market to struggle to secure financing,” Ashley Smith, REBGV president said. “Suppressing housing activity through government policy not only reduces home sales, it harms the job market, economic growth and creates pent-up demand.”


There were 5,742 detached, attached and apartment properties newly listed for sale on the Multiple Listing Service® (MLS®) in Metro Vancouver in April 2019. This represents a 1.3 per cent decrease compared to the 5,820 homes listed in April 2018 and a 16 per cent increase compared to March 2019 when 4,949 homes were listed.


The total number of homes currently listed for sale on the MLS® in Metro Vancouver is 14,357, a 46.2 per cent increase compared to April 2018 (9,822) and a 12.4 per cent increase compared to March 2019 (12,774).


“There are more homes for sale in our market today than we’ve seen since October 2014. This trend is more about reduced demand than increased supply,” Smith said. “The number of new listings coming on the market each month are consistent with our long-term averages. It’s the reduced sales activity that’s allowing listings to accumulate.”


The overall sales-to-active listings ratio for April 2019 is 12.7 per cent. By property type, the ratio is 9.4 per cent for detached homes, 15.4 per cent for townhomes, and 15.3 per cent for apartments.


Generally, analysts say downward pressure on home prices occurs when the ratio dips below 12 per cent for a sustained period, while home prices often experience upward pressure when it surpasses 20 per cent over several months.


The MLS® Home Price Index composite benchmark price for all residential properties in Metro Vancouver is currently $1,008,400. This represents an 8.5 per cent decrease over April 2018, and a 0.3 per cent decrease compared to March 2019.


Detached home sales totalled 586 in April 2019, a 27.4 per cent decrease from the 807 detached sales in April 2018. The benchmark price for a detached home is $1,425,200. This represents an 11.1 per cent decrease from April 2018, a 0.8 per cent decrease compared to March 2019.


Apartment home sales totalled 885 in April 2019, a 32.3 per cent decrease compared to the 1,308 sales in April 2018. The benchmark price of an apartment is $656,900 in the region. This represents a 6.9 per cent decrease from April 2018 and is unchanged from March 2019.


Attached home sales totalled 358 in April 2019, a 22.8 per cent decrease compared to the 464 sales in April 2018. The benchmark price of an attached home is $783,300. This represents a 7.5 per cent decrease from April 2018 and is unchanged from March 2019.


DOWNLOAD THE FULL REPORT
Read

Real Estate Board March Stats for Vancouver East & West

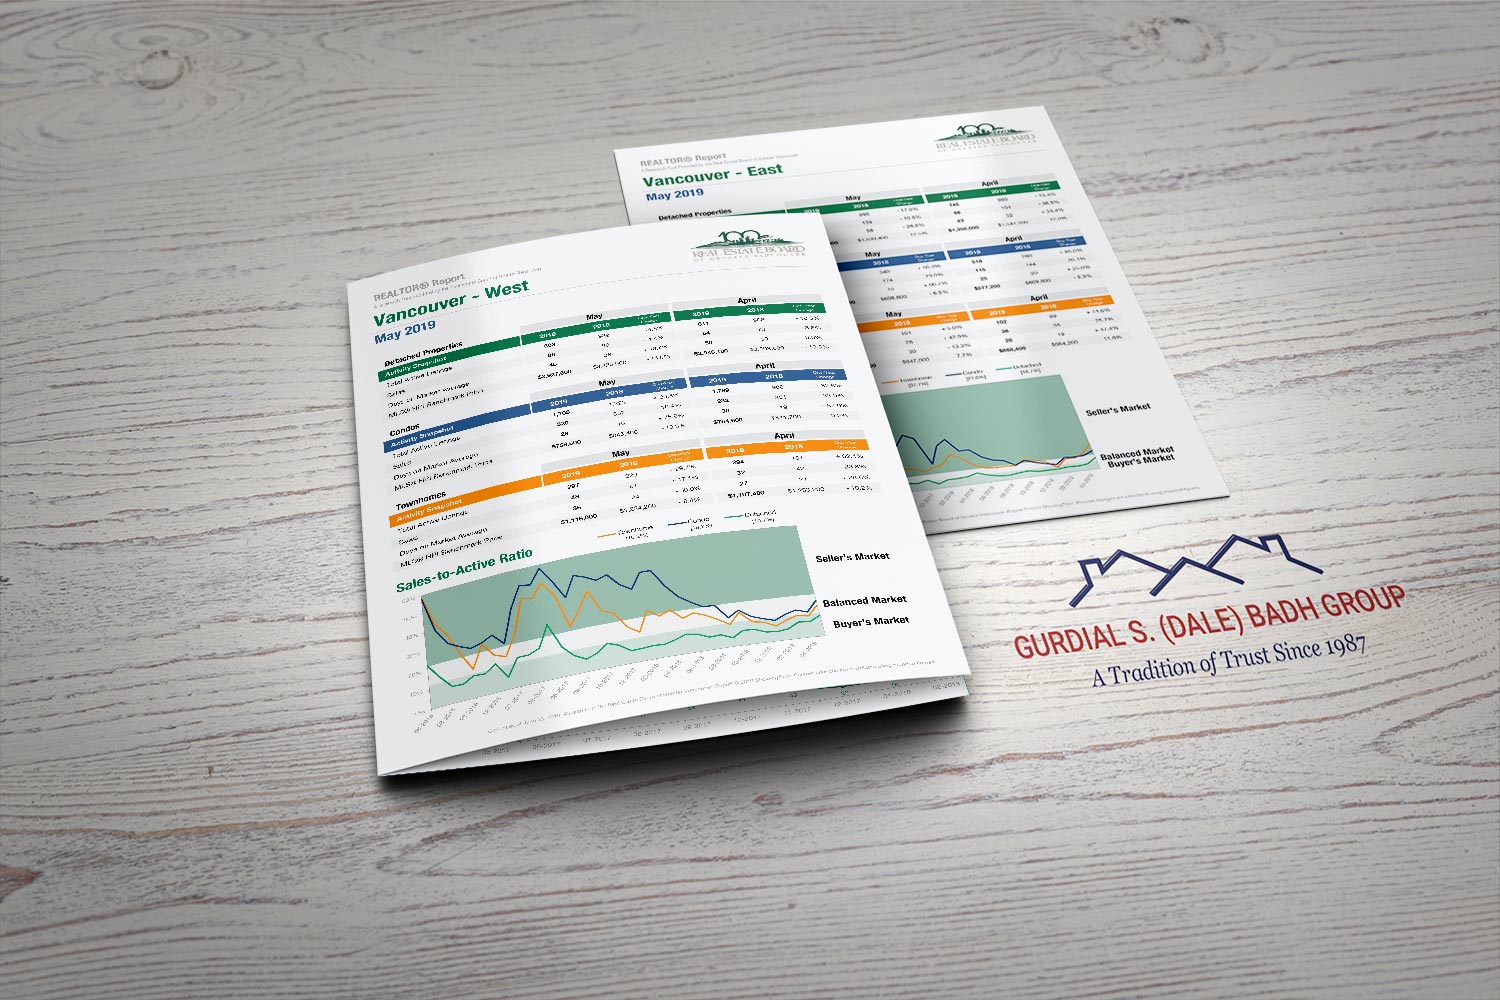
The March Market Stats Pack for East and West are out and available for download. You get the following graphs and charts for both Vancouver East and Vancouver West.

  • Activity Snapshot by Property Type
  • Detached Properties Report and Graph
  • Condo Report and Graph
  • Townhomes Report and Graph
  • Benchmark Price Graph
  • Average Price Per Square Foot

If you are interested in a report like this for other areas, please contact me to request it and I'll send it to you.


DOWNLOAD VANCOUVER EAST STATS HERE


DOWNLOAD VANCOUVER WEST STATS HERE

Read

Prospective home buyers remain on the sidelines in March

Metro Vancouver home sales dipped to the lowest levels seen in March in more than three decades.

The Real Estate Board of Greater Vancouver (REBGV) reports that residential home sales in the region totalled 1,727 in March 2019, a 31.4 per cent decrease from the 2,517 sales recorded in March 2018, and a 16.4 per cent increase from the 1,484 homes sold in February 2019.


Last month’s sales were 46.3 per cent below the 10-year March sales average and was the lowest total for the month since 1986.


"Housing demand today isn’t aligning with our growing economy and low unemployment rates. The market trends we’re seeing are largely policy induced," Ashley Smith, REBGV president said. "For three years, governments at all levels have imposed new taxes and borrowing requirements on to the housing market.”


“What policymakers are failing to recognize is that demand-side measures don’t eliminate demand, they sideline potential home buyers in the short term. That demand is ultimately satisfied down the line because shelter needs don’t go away. Using public policy to delay local demand in the housing market just feeds disruptive cycles that have been so well-documented in our region."


There were 4,949 detached, attached and apartment properties newly listed for sale on the Multiple Listing Service® (MLS®) in Metro Vancouver in March 2019. This represents an 11.2 per cent increase compared to the 4,450 homes listed in March 2018 and a 27.2 per cent increase compared to February 2019 when 3,892 homes were listed.


The total number of homes currently listed for sale on the MLS® system in Metro Vancouver is 12,774, a 52.4 per cent increase compared to March 2018 (8,380) and a 10.2 per cent increase compared to February 2019 (11,590).

For all property types, the sales-to-active listings ratio for March 2019 is 13.5 per cent. By property type, the ratio is 9.4 per cent for detached homes, 15.9 per cent for townhomes, and 17.2 per cent for apartments.


Generally, analysts say downward pressure on home prices occurs when the ratio dips below 12 per cent for a sustained period, while home prices often experience upward pressure when it surpasses 20 per cent over several months.


The MLS® Home Price Index composite benchmark price for all residential properties in Metro Vancouver is currently $1,011,200. This represents a 7.7 per cent decrease from March 2018, and a 0.5 per cent decrease compared to February 2019.


Sales of detached homes in March 2019 reached 529, a 26.7 per cent decrease from the 722 sales in March 2018. The benchmark price for a detached home is $1,437,100. This represents a 10.5 per cent decrease from March 2018, and a 0.4 per cent decrease compared to February 2019.


Sales of apartment homes reached 873 in March 2019, a 35.3 per cent decrease compared to the 1,349 sales in March 2018. The benchmark price of an apartment property is $656,900. This represents a 5.9 per cent decrease from March 2018, and a 0.5 per cent decrease compared to February 2019.


Attached home sales in March 2019 totalled 325, a 27.1 per cent decrease compared to the 446 sales in March 2018. The benchmark price of an attached home is $783,600. This represents a six per cent decrease from March 2018, and a 0.7 per cent decrease compared to February 2019.


GET THE FULL REPORT
Read
Reciprocity Logo The data relating to real estate on this website comes in part from the MLS® Reciprocity program of either the Greater Vancouver REALTORS® (GVR), the Fraser Valley Real Estate Board (FVREB) or the Chilliwack and District Real Estate Board (CADREB). Real estate listings held by participating real estate firms are marked with the MLS® logo and detailed information about the listing includes the name of the listing agent. This representation is based in whole or part on data generated by either the GVR, the FVREB or the CADREB which assumes no responsibility for its accuracy. The materials contained on this page may not be reproduced without the express written consent of either the GVR, the FVREB or the CADREB.